Diferencia entre revisiones de «Archivo:Area aproximada.png»
De MateWiki
(→Aproximación del área bajo una curva) |
(Herraiz subió una nueva versión de «Archivo:Area aproximada.png»: Rayado homogéneo) |
||
| (No se muestran 3 ediciones intermedias del mismo usuario) | |||
| Línea 1: | Línea 1: | ||
== Aproximación del área bajo una curva == | == Aproximación del área bajo una curva == | ||
| − | Para generar este archivo se ha usado la siguiente función de [[Octave UPM]] | + | Para generar este archivo se ha usado la siguiente función de [[Octave UPM]], junto con la función ''hatchfill'' que se encuentra [http://www.mathworks.com/matlabcentral/fileexchange/30733 un fichero en MATLAB Central]. |
{{ matlab | codigo = | {{ matlab | codigo = | ||
function dibujaFunc(x,f,s) | function dibujaFunc(x,f,s) | ||
| Línea 10: | Línea 10: | ||
set(gca,'LineWidth',4); | set(gca,'LineWidth',4); | ||
grid minor; | grid minor; | ||
| + | p = []; | ||
for xx = min(x):s:max(x)-s | for xx = min(x):s:max(x)-s | ||
x2 = linspace(xx, xx+s, 50); | x2 = linspace(xx, xx+s, 50); | ||
| Línea 15: | Línea 16: | ||
fill([xx xx+s xx+s xx],[0 0 f(xx+s) f(xx+s)], 'y'); | fill([xx xx+s xx+s xx],[0 0 f(xx+s) f(xx+s)], 'y'); | ||
patch([x2 xx xx],[y2 f(xx+s) f(xx)], 'r'); | patch([x2 xx xx],[y2 f(xx+s) f(xx)], 'r'); | ||
| − | + | p1 = patch([xx xx+s xx+s xx],[0 0 f(xx+s) f(xx+s)], 'y'); | |
| − | + | p = [p p1]; | |
end | end | ||
| + | hatchfill(p); % Relleno rayado | ||
plot(x,f(x), 'LineWidth',16); | plot(x,f(x), 'LineWidth',16); | ||
text(11,25,'A_1','fontsize',24,'fontweight','bold'); | text(11,25,'A_1','fontsize',24,'fontweight','bold'); | ||
Revisión actual del 15:36 20 ago 2013
Aproximación del área bajo una curva
Para generar este archivo se ha usado la siguiente función de Octave UPM, junto con la función hatchfill que se encuentra un fichero en MATLAB Central.
function dibujaFunc(x,f,s)
  clf;
  hold on;
  set(gca,'FontSize',14);
  set(gca,'FontWeight','bold');
  set(gca,'LineWidth',4);
  grid minor;
  p = [];
  for xx = min(x):s:max(x)-s
    x2 = linspace(xx, xx+s, 50);
    y2 = f(x2);
    fill([xx xx+s xx+s xx],[0 0 f(xx+s) f(xx+s)], 'y');
    patch([x2 xx xx],[y2 f(xx+s) f(xx)], 'r');
    p1 = patch([xx xx+s xx+s xx],[0 0 f(xx+s) f(xx+s)], 'y');
    p = [p p1];
  end
  hatchfill(p); % Relleno rayado
  plot(x,f(x), 'LineWidth',16);
  text(11,25,'A_1','fontsize',24,'fontweight','bold');
  text(13,25,'A_2','fontsize',24,'fontweight','bold');
  text(15,25,'A_3','fontsize',24,'fontweight','bold');
  text(17,25,'A_4','fontsize',24,'fontweight','bold');
  text(19,25,'A_5','fontsize',24,'fontweight','bold');
  xlabel('Eje X');
  ylabel('Eje Y');
  hold off;
end
Luego, se llama a la función con
>> x = linspace(10,20,100);
>> dibujaFunc(x,@(x) (3+sin(x))/100.*x.^3+x+1,2);
Historial del archivo
Haz clic sobre una fecha/hora para ver el archivo a esa fecha.
| Fecha y hora | Miniatura | Dimensiones | Usuario | Comentario | |
|---|---|---|---|---|---|
| actual | 15:36 20 ago 2013 | 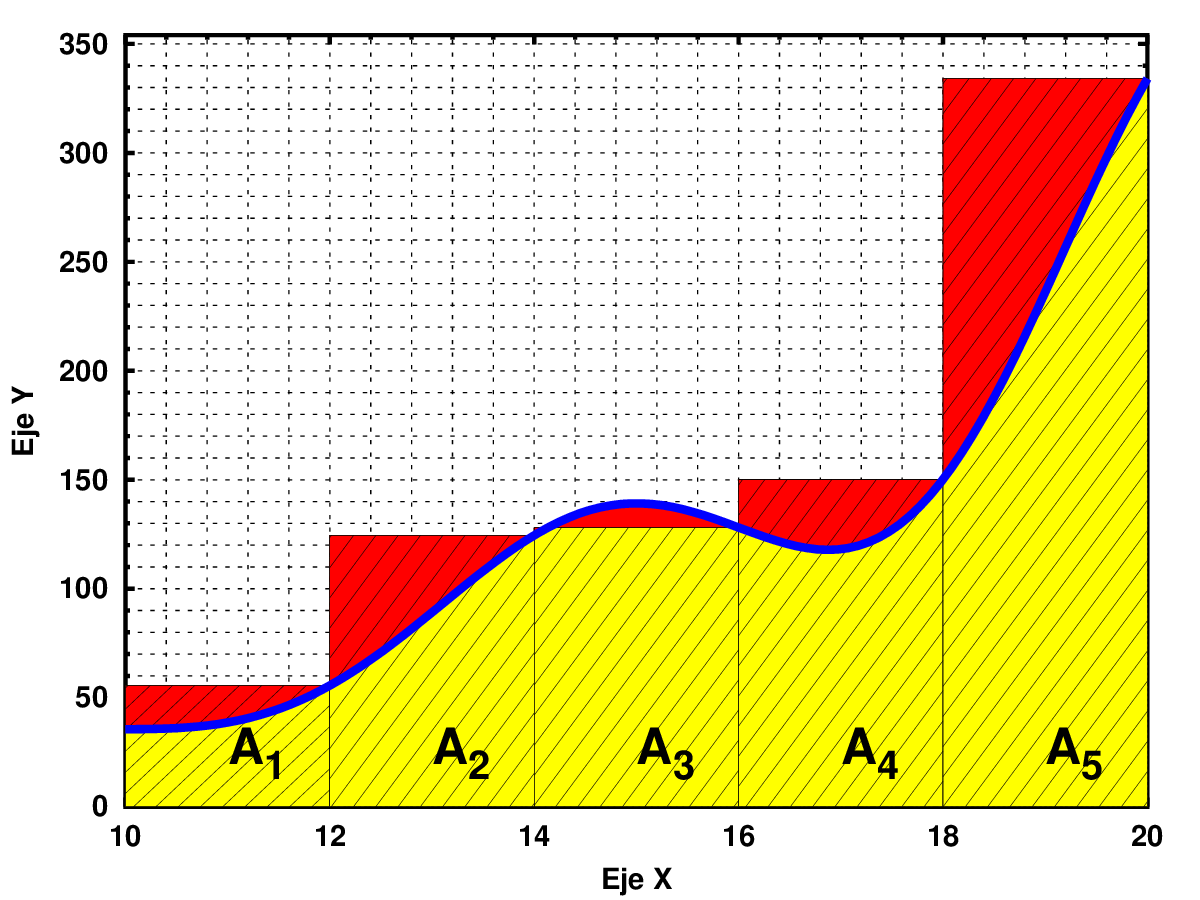 | 1200 × 900 (81 KB) | Herraiz (Discusión | contribuciones) | Rayado homogéneo |
| 19:12 19 ago 2013 |  | 1200 × 900 (48 KB) | Herraiz (Discusión | contribuciones) | Aproximación del área bajo una curva |
- No puedes sobrescribir este archivo.
Usos del archivo
La siguiente página enlaza a este archivo: